 |
PROPELLANT COMBUSTION CHARTS |
 |
PROPELLANT COMBUSTION CHARTS |
For each of the propellant combinations shown above, four graphs have been provided. These graphs can be used to estimate (1) the optimum mixture ratio of the combustion reactants, (2) the adiabatic flame temperature of the combustion reaction, (3) the average molecular weight of the combustion products, and (4) the specific heat ratio of the combustion products. This data is necessary to determine the velocity of the exhaust gases expelled from a rocket engine, which in turn determines the engine's thrust. Adiabatic flame temperature and gas molecular weight have been calculated using the freeware program STANJAN.
Mixture Ratio is the ratio of oxidizer mass to fuel mass. We define the optimum mixture ratio as that which will produce the highest specific impulse for the given reactants. A propellant's optimum mixture ratio is a function of the pressures at which the rocket engine will operate. An engine with a high combustion chamber pressure and a low nozzle exit pressure, i.e. a large section ratio, will have the highest optimum mixture ratio.
Below we see a graph of optimum mixture ratio versus combustion chamber pressure for liquid oxygen and kerosene at two different nozzle exit pressures (Pe). To use this graph, select the desired chamber pressure across the bottom axis of the graph and draw a vertical line. When the vertical line intersects the curve for the desired exit pressure, draw a horizontal line to the left and read the corresponding mixture ratio off the vertical axis of the graph. If an exit pressure other than those shown is desired, estimate the position of the exit pressure curve by interpolating between those given. For instance, the curve for a Pe of 0.7 atmosphere lies approximately one-third the distance from the Pe = 1.0 curve to the Pe = 0.1 curve. In the given example we've selected a combustion chamber pressure of 75 atmospheres and a nozzle exit pressure of 1 atmosphere, which gives us an optimum mixture ratio of 2.30.

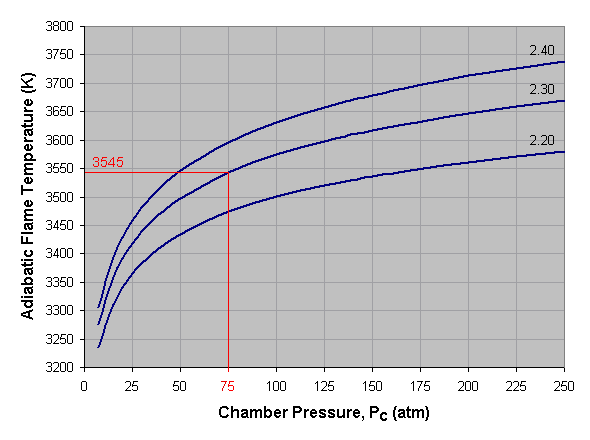
Adiabatic flame temperature is the temperature achieved by a combustion reaction that takes place adiabatically, that is, with no heat entering or leaving the system. It is the maximum temperature that can be achieved for the given reactants and is used to estimate the combustion chamber temperature (Tc) in a rocket engine.
Below we see a graph of adiabatic flame temperature versus combustion chamber pressure for liquid oxygen and kerosene at three different mixture ratios. To use this graph, select the desired pressure across the bottom axis of the graph and draw a vertical line. When the vertical line intersects the curve for the desired mixture ratio, draw a horizontal line to the left and read the corresponding adiabatic flame temperature off the vertical axis of the graph. If a mixture ratio other than those shown is used, estimate the position of the mixture ratio curve by interpolating between those given. For instance, the curve for a mixture ratio of 2.25 lies approximately midway between the 2.20 and 2.30 curves. In the given example we've selected a pressure of 75 atmospheres and a mixture ratio of 2.30, which gives us an adiabatic flame temperature of approximately 3,545 Kelvin.

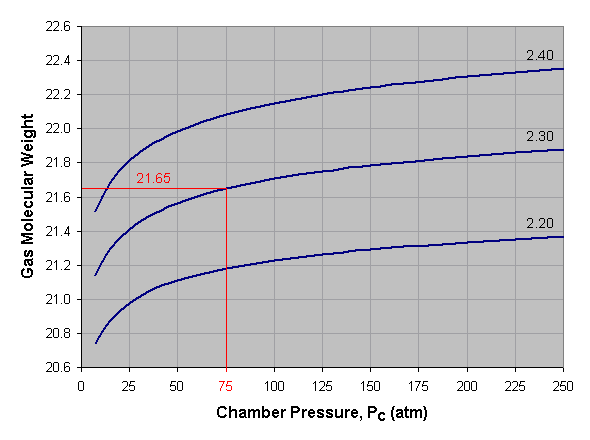
The exhaust gas molecular weight is the average molar weight of the combustion products, that is, the mass of the exhaust gas divided by the number of moles.
Below is a graph of gas molecular weight versus combustion chamber pressure for liquid oxygen and kerosene at three different mixture ratios. To use this graph, select the desired pressure across the bottom axis of the graph and draw a vertical line. When the vertical line intersects the curve for the desired mixture ratio, draw a horizontal line to the left and read the corresponding gas molecular weight off the vertical axis of the graph. For mixture ratios other than those shown, estimate by interpolating between the given curves. In the provided example we've selected a pressure of 75 atmospheres and a mixture ratio of 2.30, which gives us an average gas molecular weight of about 21.65.
The gas molecular weights shown below are taken at the combustion chamber. The molecular weight will increase slightly as the gas expands and cools while moving toward the nozzle exit.

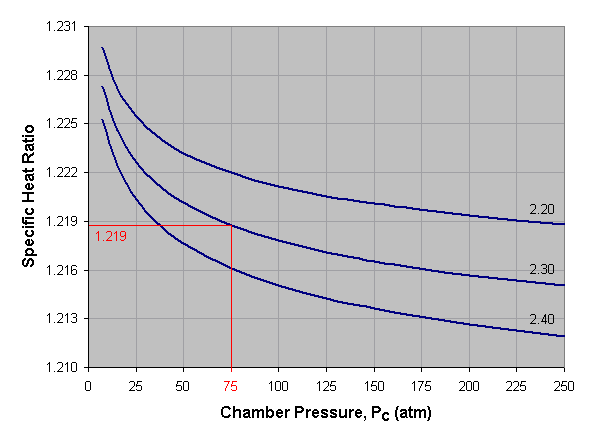
Specific heat is the amount of heat necessary to raise the temperature of one gram of a substance one degree Celsius. Specific heat ratio is the ratio of constant-pressure specific heat to constant-volume specific heat.
Below is a graph of specific heat ratio versus combustion chamber pressure for liquid oxygen and kerosene at three different mixture ratios. To use this graph, select the desired pressure across the bottom axis of the graph and draw a vertical line. When the vertical line intersects the curve for the desired mixture ratio, draw a horizontal line to the left and read the corresponding specific heat ratio off the vertical axis of the graph. For mixture ratios other than those shown, estimate by interpolating between the given curves. In the provided example we've selected a pressure of 75 atmospheres and a mixture ratio of 2.30, which gives us a specific heat ratio of about 1.219.
The specific heat ratios shown below are taken at the combustion chamber. As the gas moves toward the nozzle exit it will expand and cool, thus increasing the specific heat ratio slightly. In practice, an average value of specific heat ratio is used when calculating exhaust gas velocity.

Written by Robert A. Braeunig, copyright 2005.